 I originally had my PV solar panels and inverter installed on the 12th August 2012 (15 months ago) and since then I have always wanted to get all the statistics logged. I was originally planing on logging to a local database which would then require a custom application written to pull the information from the inverter and to then pull that data into usable information.
![]()
since then I came across PVOutput which looked fantastic and offered the facility to upload the statistics from your inverter allowing you to access a WEB site that presented the information to you in good looking graphs. When I stumbled across this site I just had to use it rather than going to the effort of producing my own.
One problem I contended with was I could not justify the cost of leaving a computer on for the six to eight hours a day just to obtain the statistics form the inverter. My computer seems to use on average 120 watts per hour, meaning it would coast at current electricity prices nearly $300 every year just to accumulate the data.

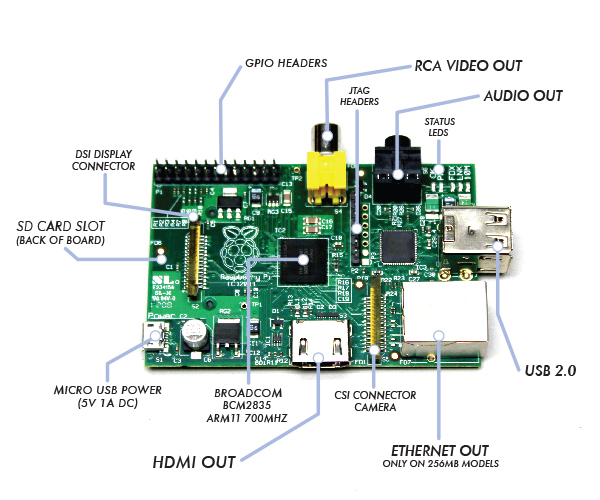
Some time ago I came across the Raspberry Pi which is a small computer utilising the ARM chipset. This device only uses two watts per hour meaning the yearly cost is well under $10 per year for eight hours a day of operation or under $20 per year to run 24*7. So this became a real viable option. I currently use the Raspberry Pi for my home PBX system and for running my own private cloud solution which uses BitTorrent Sync.
Three and a half weeks have passed since I have configured my rPi to gather the logs from my Inverters and the data is starting to produce some useful information.
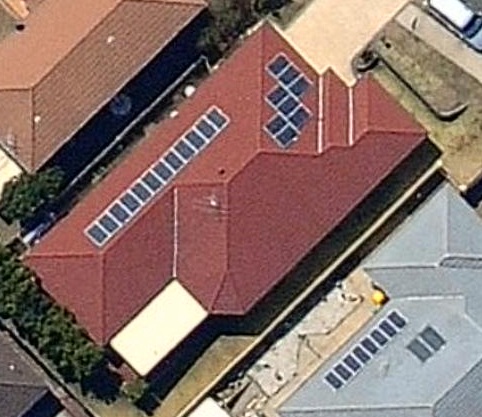
I have two individual systems. A 2kW and a 3kW. The 2kW is facing North East and the 3kW is facing North West.
If you are interested in building your own system I do have a document on how to build and configure your own. Please go to PVOutput_with_the_Raspberry_Pi_and_SolarRiver_Inverters on my Wiki for details.


